Coca-Cola West/Coca-Cola East Japan Financial Highlights Archive
Consolidated Financial Highlights
2016-2012
| |
2012 |
2013 |
2014 |
2015 |
2016 |
| Net sales |
386,637 |
431,711 |
424,406 |
440,476 |
460,455 |
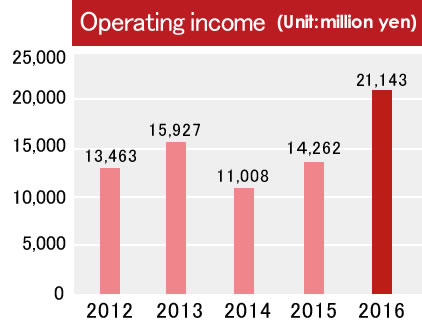
| Operating income |
13,463 |
15,927 |
11,008 |
14,262 |
21,143 |
| Recurring profit |
13,845 |
16,606 |
10,609 |
13,723 |
20,602 |
| Profit (loss) attributable to owners of parent |
6,031 |
13,625 |
4,482 |
9,970 |
5,245 |
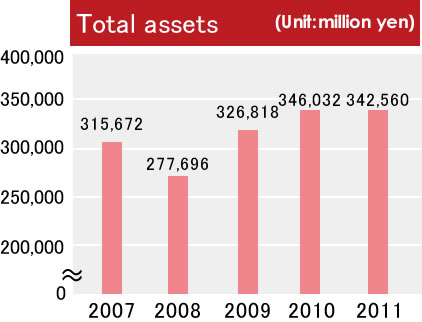
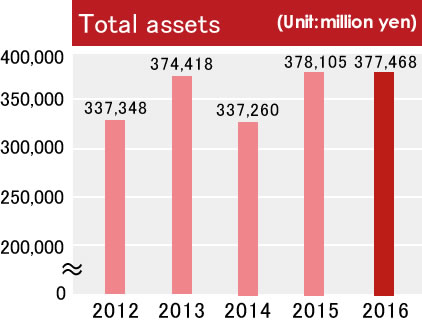
| Total assets |
337,348 |
374,418 |
337,260 |
378,105 |
377,468 |
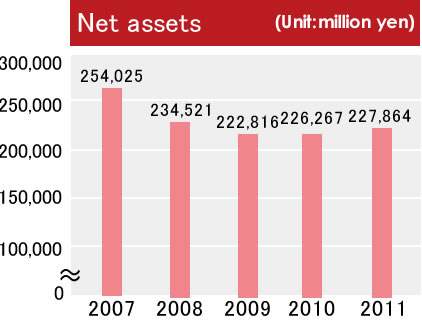
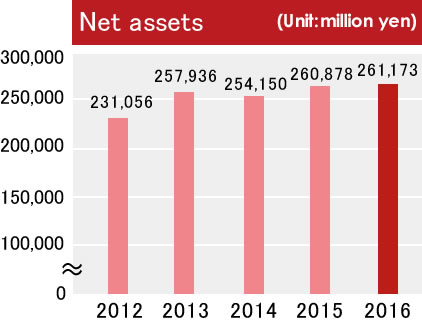
| Net assets |
231,056 |
257,936 |
254,150 |
260,878 |
261,173 |
2011-2007
| |
2007 |
2008 |
2009 |
2010 |
2011 |
| Net sales |
409,521 |
395,556 |
369,698 |
375,764 |
399,717 |
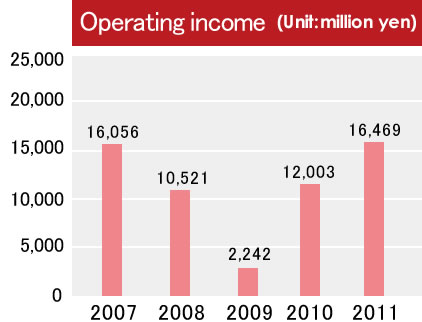
| Operating income |
16,056 |
10,521 |
2,242 |
12,003 |
16,469 |
| Recurring profit |
17,493 |
11,048 |
2,085 |
12,659 |
16,044 |
| Profit (loss) attributable to owners of parent |
9,375 |
129 |
-7,594 |
7,582 |
6,997 |
| Total assets |
315,672 |
277,696 |
326,818 |
346,032 |
342,560 |
| Net assets |
254,025 |
234,521 |
222,816 |
226,267 |
227,864 |
Consolidated Financial Highlights Download


 attributable to owners of parent")


 attributable to owners of parent")